Bankside 3,
100 Southwark Street,
London, SE1 0SW
The Census takes place every 10 years and generates a snap-shot of the UK population. The first phase of the 2021 Census was released last week, compiling the most detailed data on the make-up of the UK since 2011. As a business with consumers at the heart of what we do, knowing the shifts in our population; who they are, where they are and their wellbeing; is vital.
While the full Census data set won’t be released until mid-2023, a staggered release of individual sets of data will begin from Autumn to Winter 2022. To keep you informed, OMG Unite have created ‘Census Shifts’, a content series exploring the trends and changes seen over the last three decades in our population (comparing 2001 – 2011 Census data with 2011- 2021), with a cultural twist.
This blog post covers population and household estimates for England and Wales, at local authority level, cross tabulated by sex and age. From Autumn 2022 onwards 8 different topic summaries will be released periodically:
a. Demography and migration
b. Ethnic group, national identity,
language, and religion
c. Health, disability, and unpaid care
d. Housing
e. Labour market and travel to work
f. Sexual orientation and gender identity
g. Education
h. UK armed forces veterans
Please note that the language, terminology and segmentation used throughout this blog post is consistent with that of the Census.
Population is growing at a declining rate and the forecast growth of non-White ethnic groups will be difficult for brands to ignore
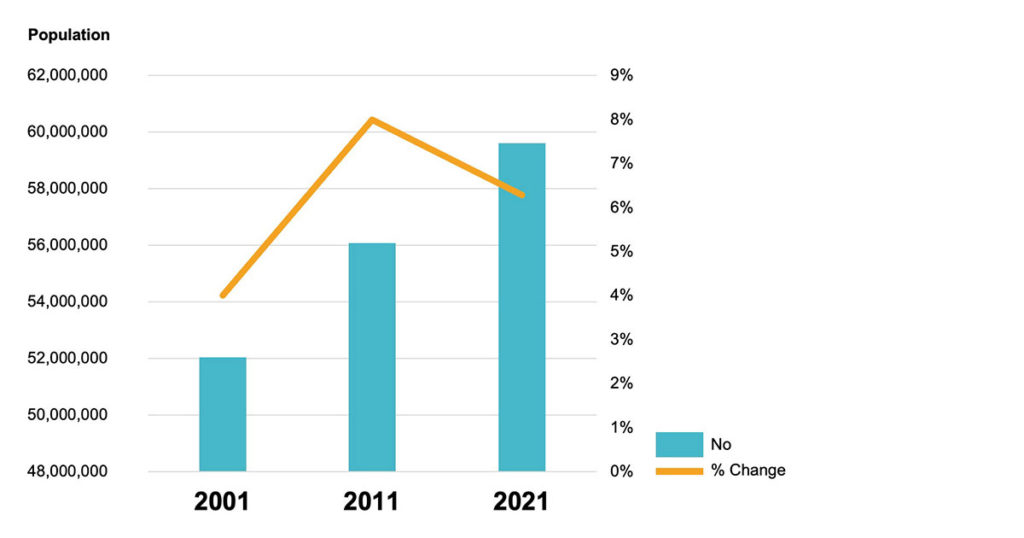
The total population of England and Wales was 59,597,300 in 2021 which is the largest recorded population to date; however, growth has slowed. There was an 8% increase in population size between 2001 (52m) and 2011 (56m) and this has decreased to 6.3% between 2011 and 2021.
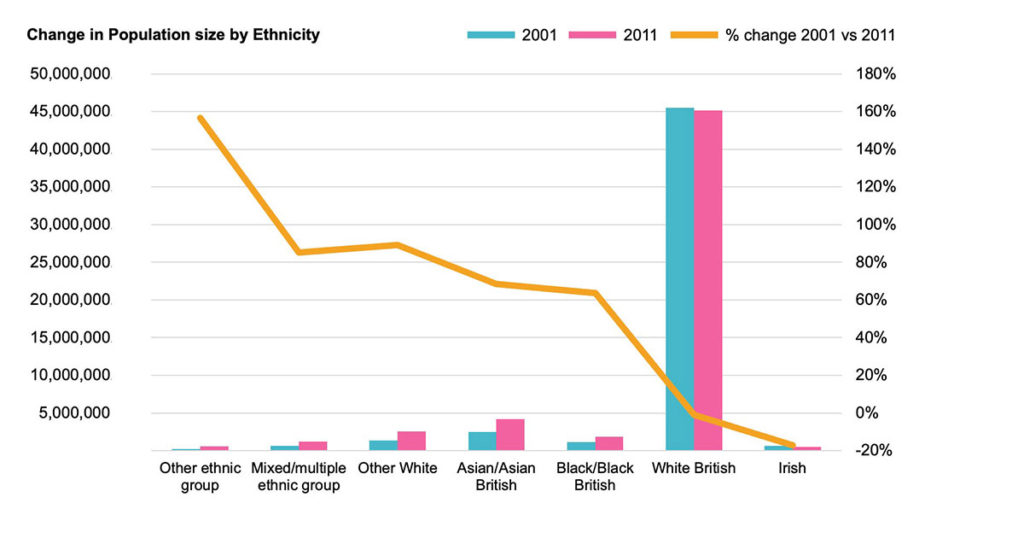
Using the 2001 and 2011 data, we can extrapolate the change in population size by ethnic group. Between 2001 and 2011, the White British population saw a 1% decrease in size and Irish saw a decrease of 17%, in size, whereas all other ethnic groups combined increased by 77%.
Based on recent data, we predict that the population growth rate in other ethnic groups seen from the 2001 – 2011 data will continue to increase. In 2021, the Census results show that out of the 3.5m recorded increase in population size, 57.5% is due to net positive migration. Alongside this, over a third of all children born in England and Wales have either one or both parents born outside the UK in recent years, with 34.8% in 2020 being the highest ever number recorded.
In 2021, the Census results show that out of the 3.5m recorded increase in population size, 57.5% is due to net positive migration. Alongside this, over a third of all children born in England and Wales have either one or both parents born outside the UK in recent years, with 34.8%i in 2020 being the highest ever number recorded. This doesn’t include ethnic minority parents born in the UK.
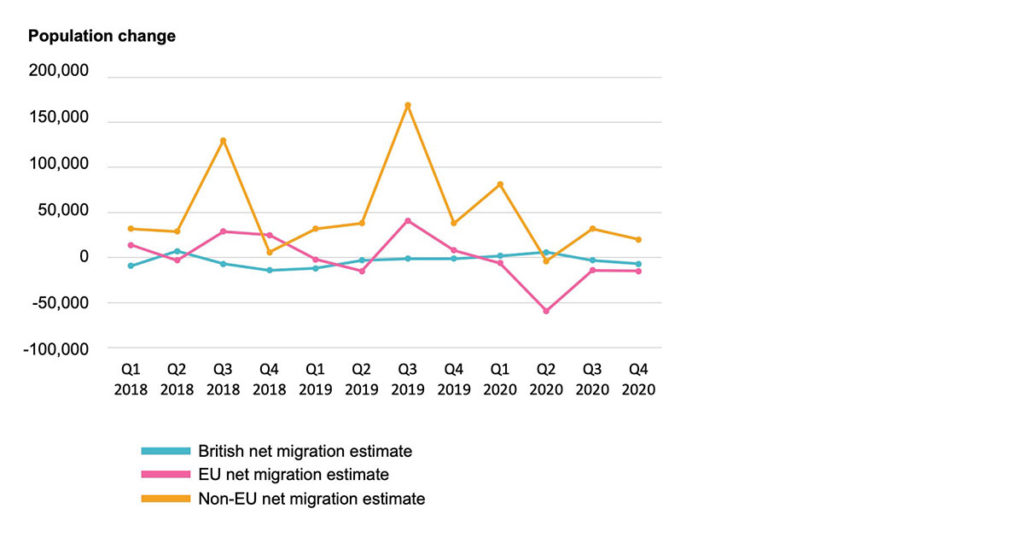
While Brexit has caused negative changes to EU Net immigration in recent years, non-EU net migration is still on the rise.
These statistics show that the non-White British segments are driving population growth. It is therefore incredibly important for brands to acknowledge the UK’s diverse population and ensure they have relevant communications that reach these communities, in the right place, with the right message.
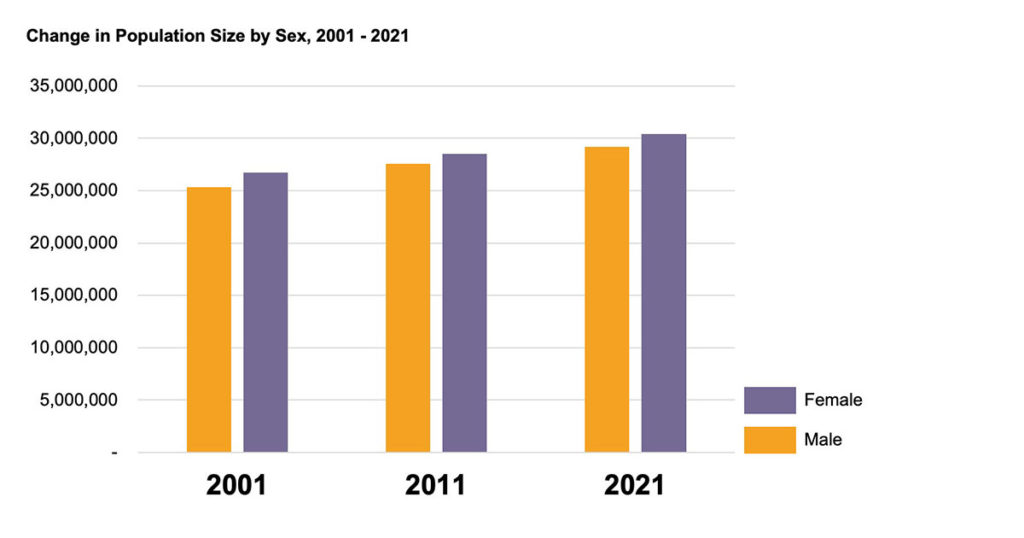
Sex splits remained largely the same with a slight increase for Females
The split between Female and Male individuals within England and Wales has remained broadly the same over the course of the last three decades with a ratio of around 51% to 49%.
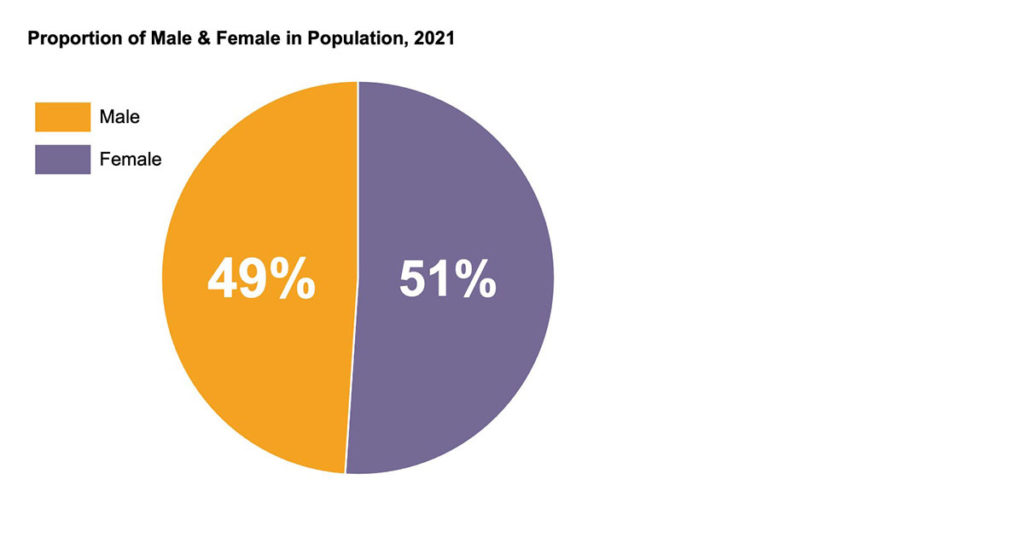
When looking at Sex by ethnic group, the splits are largely inline with the general population with 1% higher Female population for those of non-White ethnic groups combined.
We’ll be digging deeper into sexual orientation and gender identity when the data is released later this year.
We are older than ever before but the non-White ethnic group is forecast to be younger than the general population
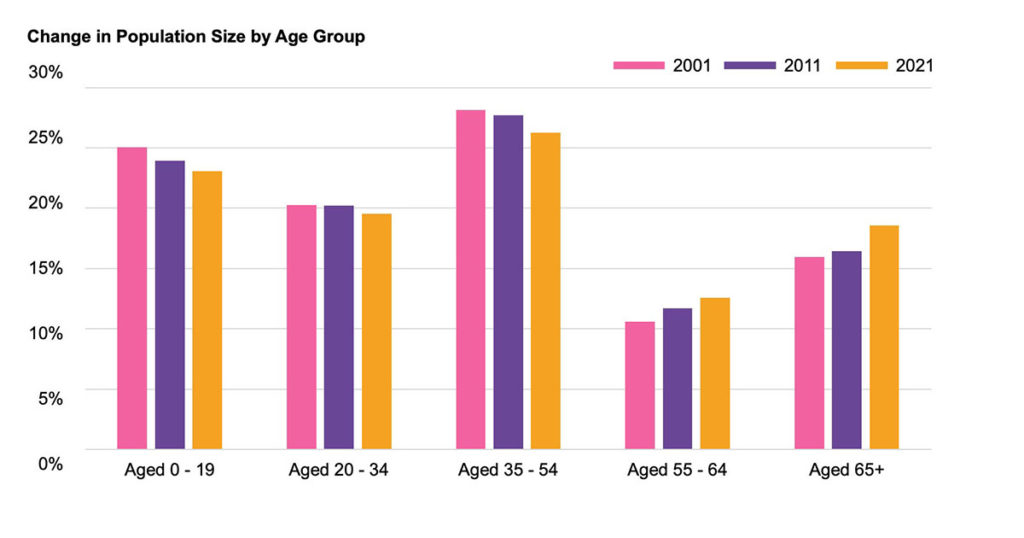
The longstanding trend of an ageing population in England and Wales continues with 18.6% of the population 65 years+ (11.1m) in 2021, compared to 15.97% (8.3m) in 2001 and 16.45% in 2011 (9.2m).
The 55 – 64 age group shows a similar pattern; having increased from 10.6% (5.5m) of the population in 2001, 11.7% (6.6m) in 2011, to 12.6% (7.5m) in 2021.
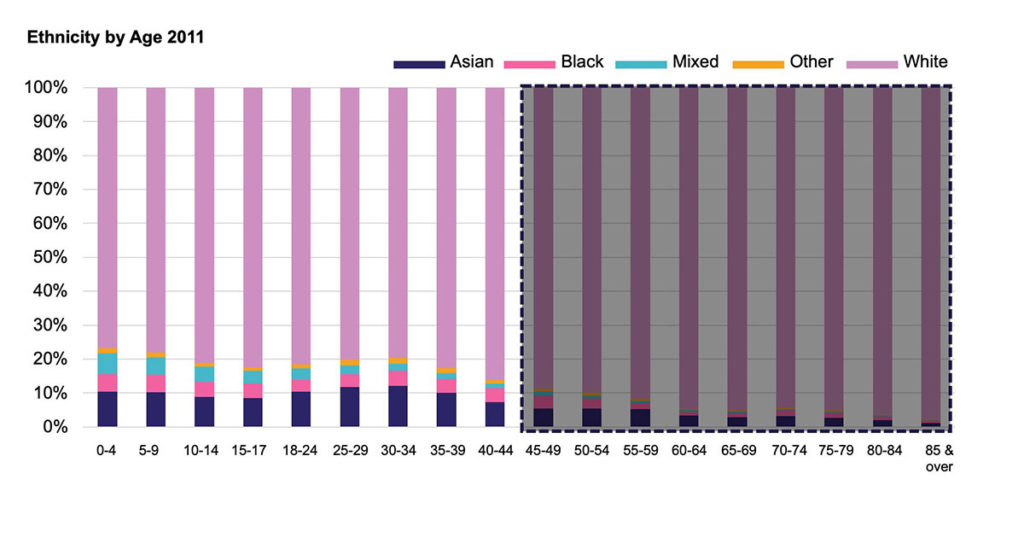
The 2011 Census showed that the ageing population is driven by the White ethnic group, making up a much higher percentage of those aged 45+ vs other ethnicities.
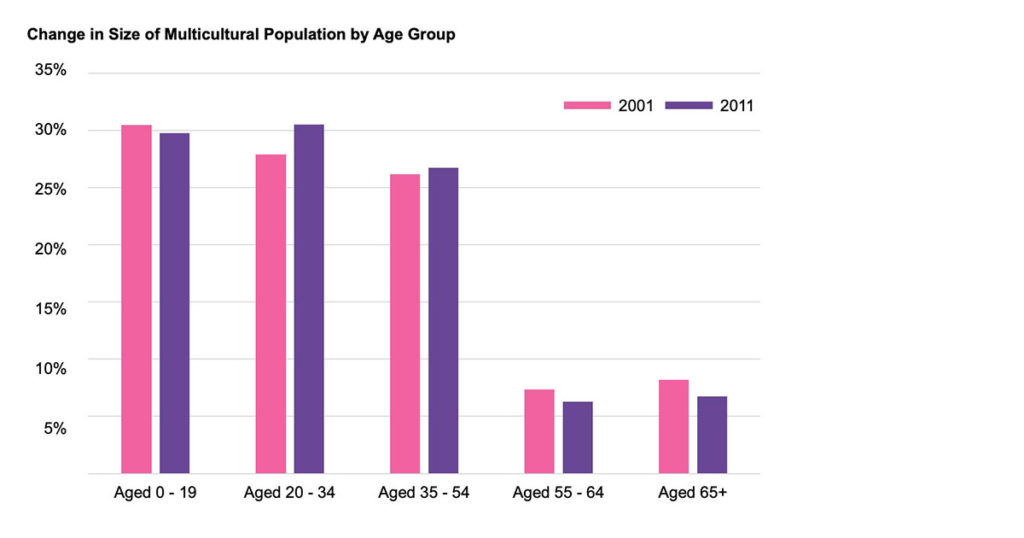
In contrast to this, the Multicultural population skews younger than the general population, with declines in both the 55-64 and 65+ age groups from 2001-2011.
The proportion of 20–34-year-olds increased from 27.9% to 30.5% from 2001-2011 and the 35 – 54 age group also experienced a slight increase from 26.1% to 26.7%.
For brands with a target audience of those aged 45 and below, it is key to embed a strategy of “how to win” non-White ethnic groups to futureproof their businesses.
Household estimates
24,782,800 households were recorded in 2021, a 6% increase from 2011 versus an 8% increase from 2001 – 2011.
The region experiencing the greatest increase in household figures between 2011 and 2021 was the East (+8.5%) followed by the South West (+8.1%).
On a local authority level, Kensington and Chelsea saw the largest drop in households (-15%) from 2011-2021, whereas Tower Hamlets has consistently seen the highest increase in households; 19% from 2011-2021 and 29% from 2001-2011.
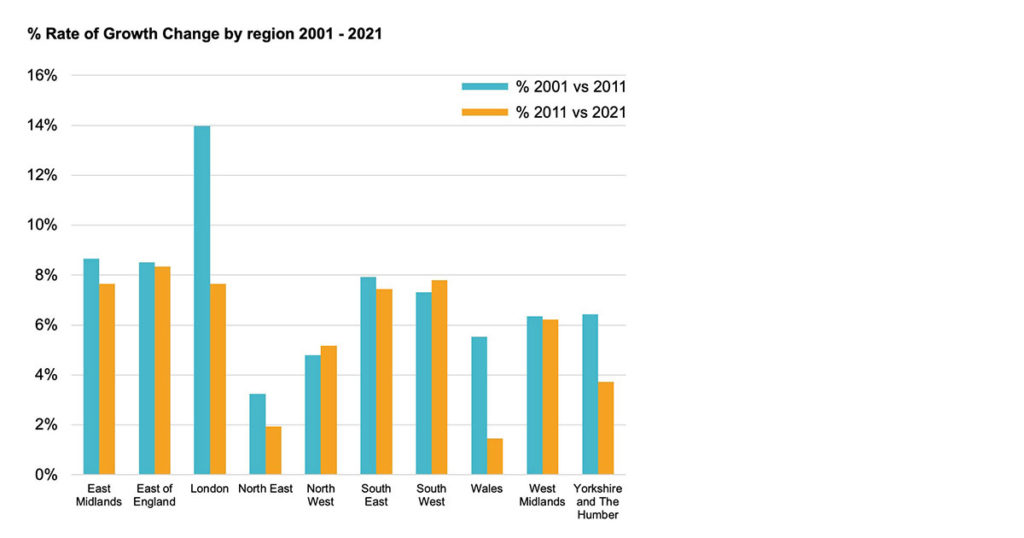
Regional and local changes
The population size across all regions increased between 2011 and 2021 with the largest increase in the East of England (8.3%).
That said, most regions experienced a slower growth rate vs. 2001 – 2011. For example, the change in population size between 2001 and 2011 in London was 14% compared to only 6% between 2011 and 2021. Regions that were an exception to the rule were the North West and the South West.
The three local authority areas that saw the greatest reduction in population size between 2011 to
2021 were Kensington and Chelsea (-10%), Westminster (-7%) and Ceredigion (-6%). The three local
authority areas experiencing the greatest increase were Tower Hamlets (22%), Dartford (20%) and
City of London (18%).
Conclusion
The UK’s population is changing. What is clear from the first set of data is that targeting
Multicultural groups will be increasingly important for brands. To futureproof their businesses
and to drive growth it is vital for brand owners to build and embed strategies to win this sizeable,
young and ever-growing part of the population.
Disclaimer: Figures may appear slightly different to ONS bulletins due to the rounding
done by Census/ONS on the released datasets.